Native Swift 6 · Apple Silicon · Offline by default

Every vital stat on your Mac. Nothing you don't need.

Real-time Apple silicon telemetry, intelligent keep-awake, and visual disk space inspection, unified in a small utility that lives quietly in your menu bar and never clutters the Dock.

Apple silicon (M-series) · macOS 26+

Try the look

Interactive demo is on desktop.

Experience KeepStat in your browser

Test-drive the real-time menu bar capsule, the drop-down popover, and the full multi-module window interface right here. Click around to explore sensor readouts, sleep prevention, and disk inspection.

💡 Tip: Click the menu bar capsule or cup icon⚡ Real Apple Silicon layout🔒 Offline until you enable public IP or updates
KeepStat
AwakeIndefinite
CPU
21%
Usage21%
Idle79%
P-cores6%
S-cores30%
1m 5m 15m1.65 1.73 1.74
Top CPU processes% of one core
KeepStat1.9%
Activity Monitor1.2%
Grok Bot0.9%
cursor-agent-worker-sea0.4%
zsh0.1%
RAM
70%
Used16.77 GB
Free1.47 GB
Wired3.46 GB
Compressed2.91 GB
Cached5.76 GB
Swap1.49 GB
Pressurenormal
Top memory processes
cursor-agent-worker-sea212.1 MB
python3.13177.7 MB
Grok Bot Helper (Renderer)165.0 MB
python3.13115.2 MB
Grok Bot106.1 MB
MacBook Pro 14" (M5 Pro)
macOS 27.2 Beta (26B5086k)
CPU 7% RAM 71% GPU 2% 39 °C
NameJM-MBP
ProcessorApple M5 Pro
15 cores, 15 threads
10 performance cores
5 super cores
Memory24 GB
GraphicsApple M5 Pro (16 cores)
DisksMacintosh HD (994.61 GB)
DisplayBuilt-in Liquid Retina XDR Display
14-inch (3024 × 1964), 120Hz
Model identifierMac17,9
Serial numberXXXXXXXXXX
Uptime2 days, 12 hours
8%
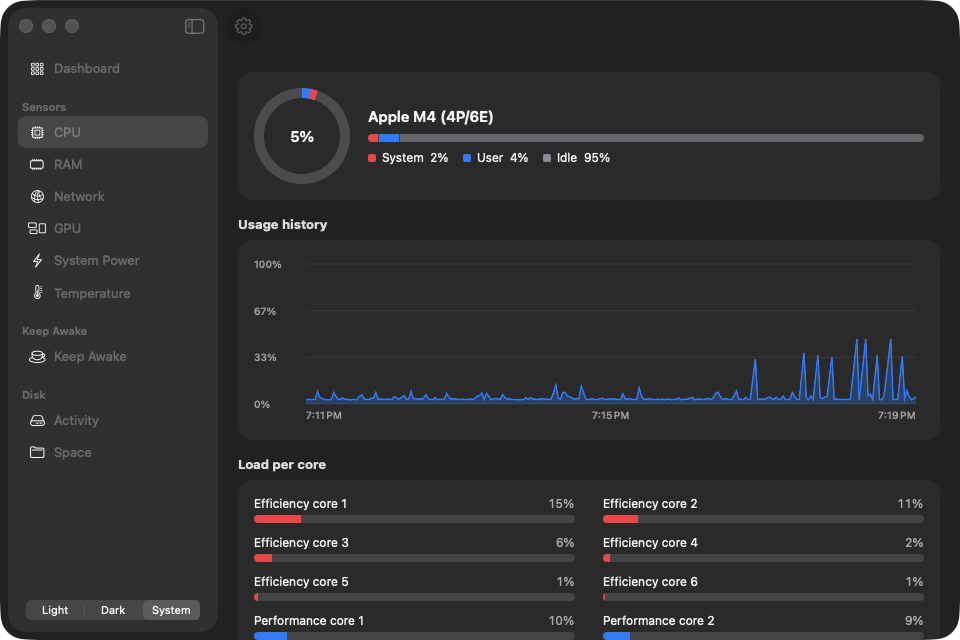
Apple M5 Pro (10P/5S)
System 2% User 6% Idle 92%
Usage history
100%67%33%0%
7:36 PM7:40 PM7:44 PM
Top CPU processes% of one core
KeepStat8.4%
Grok Bot0.8%
cursor-agent-worker-sea0.5%
Activity Monitor0.4%
zsh0.2%
Load per core
Average load
1 minute1.65
5 minutes1.73
15 minutes1.74
70%
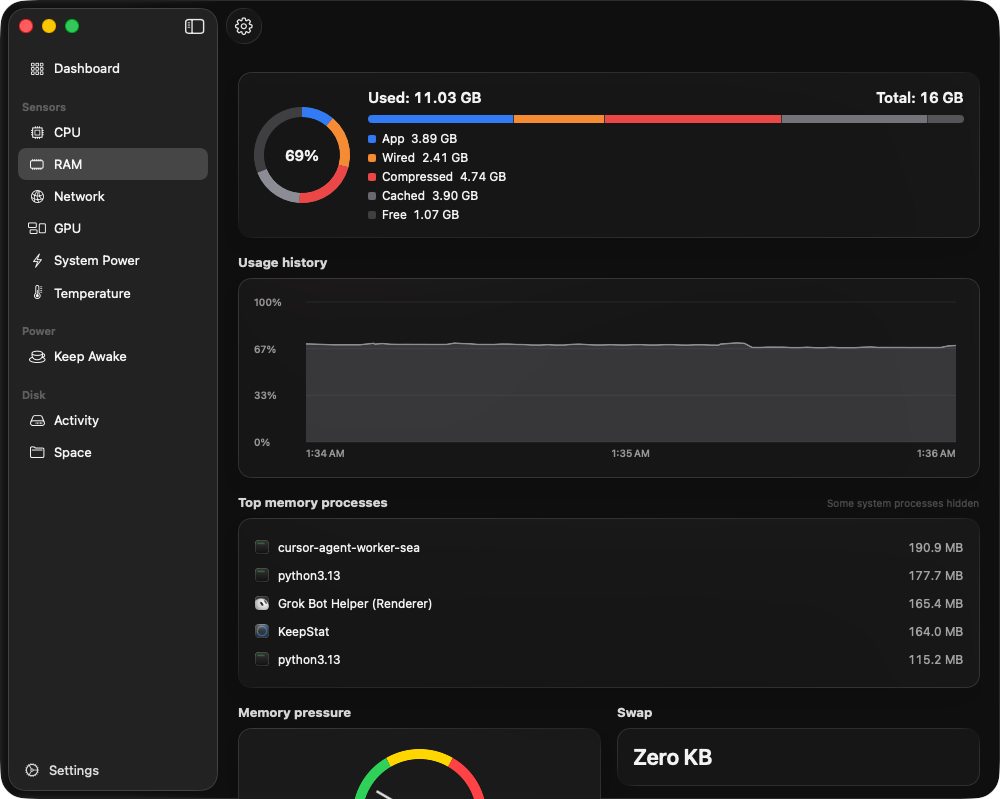
Used: 16.77 GBTotal: 24 GB
App10.39 GB
Wired3.46 GB
Compressed2.91 GB
Cached5.76 GB
Free1.47 GB
Usage history
100%67%33%0%
8:37 AM8:41 AM8:45 AM
Top memory processesSome system processes hidden
cursor-agent-worker-sea212.4 MB
python3.13177.7 MB
Grok Bot Helper (Renderer)165.1 MB
python3.13115.2 MB
Grok Bot112.8 MB
Memory pressure
Normal
Swap
1.49 GB
5.9 MB/s
Download
19 KB/s
Upload
Throughput
14.7 MB/s9.8 MB/s4.9 MB/s0 KB/s
8:43 AM8:47 AM8:51 AM
Apps
curl3.0 MB/s down
mDNSResponder4 KB/s down
Grok Bot Helper0 KB/s
Connectivity history
Details
Total upload522.1 MB
Total download1.2 GB
StatusUP
Interface
InterfaceWi-Fi (en0)
StatusUP
Connection typeWi-Fi
Address
Local IPen0 192.168.1.142

Looks up this Mac's address at api.ipify.org.

Apple M5 Pro (16 cores)
GPU utilization18%
Renderer utilization16%
Tiler utilization11%
GPU utilization history
100%67%33%0%
8:37 AM8:45 AM
Renderer utilization history
100%67%33%0%
8:37 AM8:45 AM
Tiler utilization history
100%67%33%0%
8:37 AM8:41 AM8:45 AM
9.1 W
System
41 °C
Hottest · Die 8
16 sensors
Coolest 32 °C
Sensors

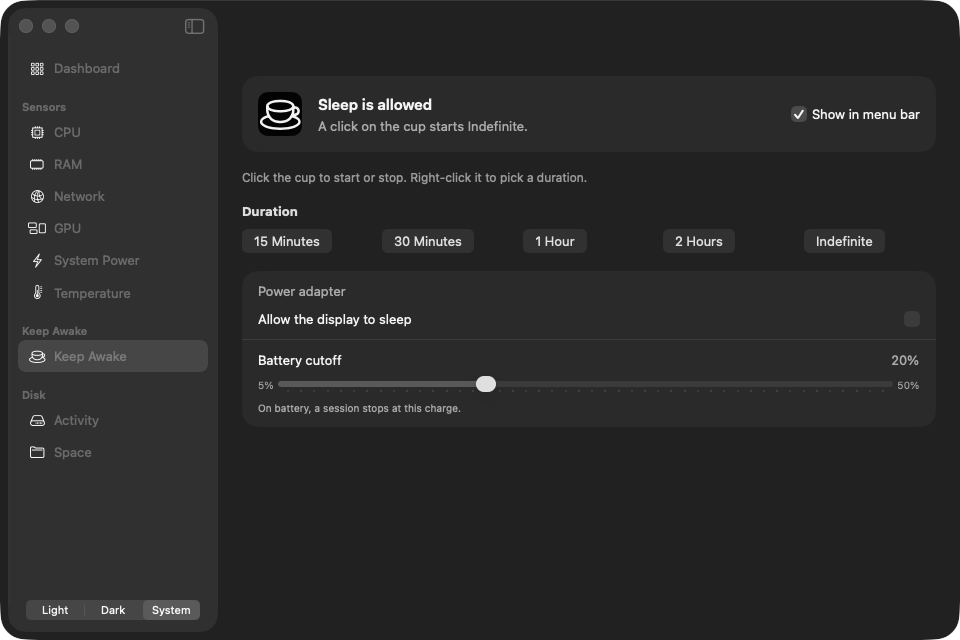
Sleep is allowed

A click on the cup starts Indefinite.

Click the cup to start or stop. Right-click it to pick a duration.
Duration
Battery 100%
Allow the display to sleep
Battery cutoff15%
5%50%
On battery, a session stops at this charge.
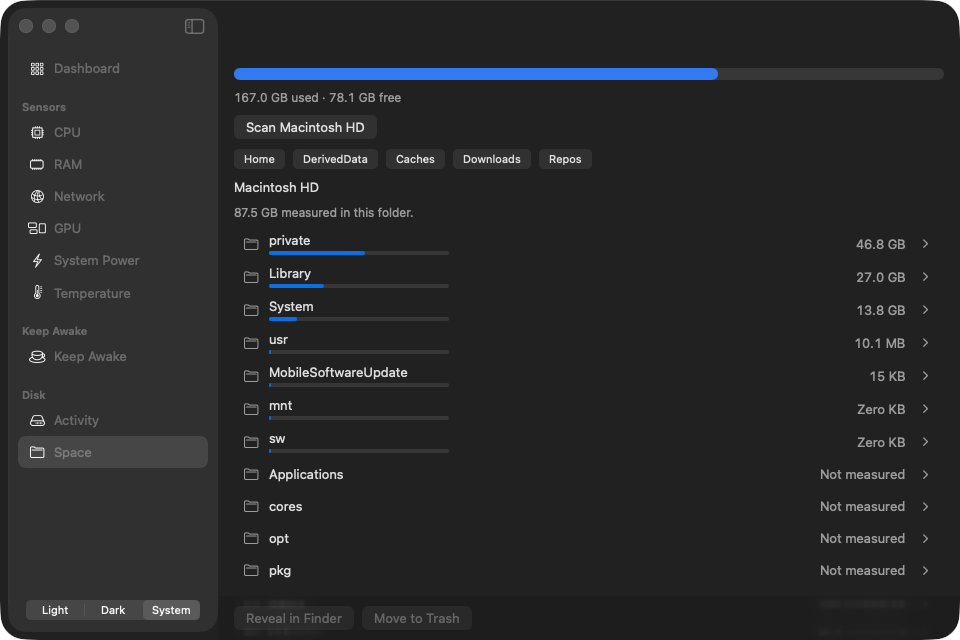
Macintosh HDAPFS994.61 GB
Used 484.86 GB Free 509.75 GB
Read / Write history
56.6 MB/s37.7 MB/s18.9 MB/s0 KB/s
8:37 AM8:41 AM8:45 AM
Details
Read146 KB/s
Write2.0 MB/s
Total read472.0 GB
Total written240.5 GB
ModelAPPLE SSD AP1024Z Media
BSD namedisk0
WritableYes
484.8 GB used · 509.8 GB free
Macintosh HD
429.7 GB measured in this folder.
Move to Trash

Three essential utilities. Zero wasted cycles.

Precision Hardware Telemetry

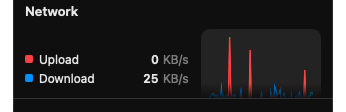
CPU, memory, GPU, network, and temperature sit in the menu bar and the popover. Top CPU processes and Top memory processes show which apps are using the Mac. Network lists which apps send and receive the most while that view is open.

Intelligent Sleep Prevention

The menu bar cup holds the Mac awake. Click it to start or stop, or right-click for a timed session. On battery, the session stops at the cutoff you set.

Visual Disk Space

Open a folder and see how large each item is. Move a selection to the Trash after you confirm. The drive root, /Users, and your home folder stay protected.

Engineered for Efficiency

What it does while it runs

Native Swift 6. No web view, no launch daemon, and no kernel extension. With only the menu bar showing, it uses about 0.3% of one core and samples about every 5 seconds. With the popover open it uses about 3 to 5% and samples about every 1.5 seconds. It skips samples while the display is asleep, the Mac is asleep, or the screen is locked. A hidden section does not keep sampling. Chart history covers about 8 minutes. Under memory pressure it keeps the latest point.

Designed to feel right at home on macOS

KeepStat CPU, RAM, and cup in the macOS menu bar
Menu bar readoutsGlanceable CPU and RAM usage, and one-click sleep toggle
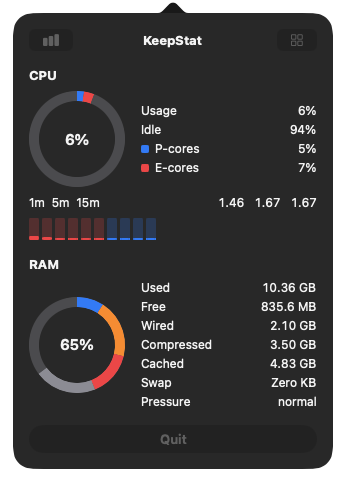
KeepStat popover with live CPU, RAM, and per-core telemetry
Compact popoverTop CPU processes, Top memory processes, and the per-core load strip
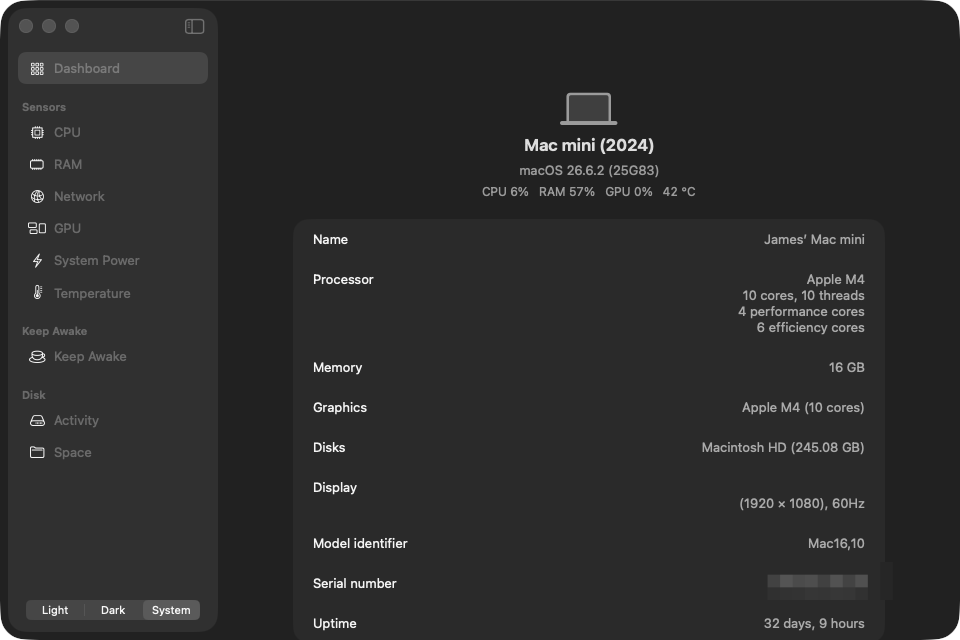
KeepStat dashboard system overview on MacBook Pro
Hardware overviewSystem specs, chip architecture, uptime, and real-time load
KeepStat keep awake duration controls and battery protection
Precision sleep controls15 minutes, 30 minutes, 1 hour, 2 hours, or until you stop it. The battery cutoff starts at 20%.
KeepStat disk space analyzer with folder hierarchy and usage shares
Visual disk analyzerHierarchical folder inspection with quick jumps to developer bloat
KeepStat CPU page with Top CPU processes and per-core loads
Top CPU processesShare of one core, then the load on each core
KeepStat RAM page with Top memory processes in a card
Top memory processesThe same card as CPU, with one decimal on every amount
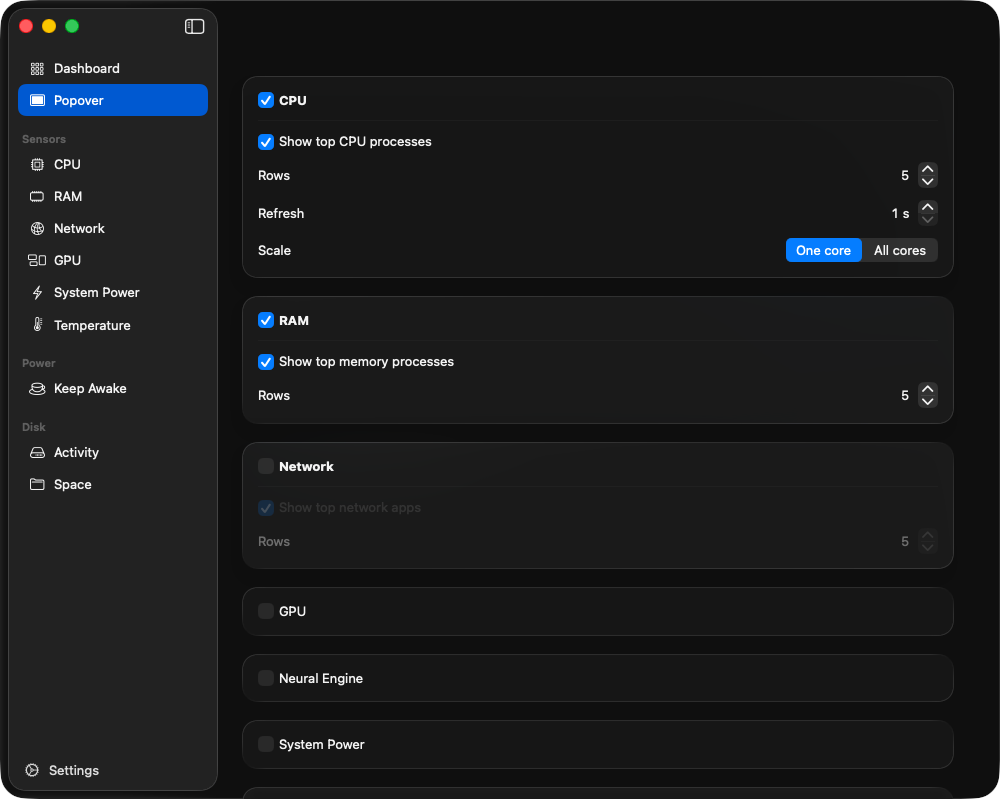
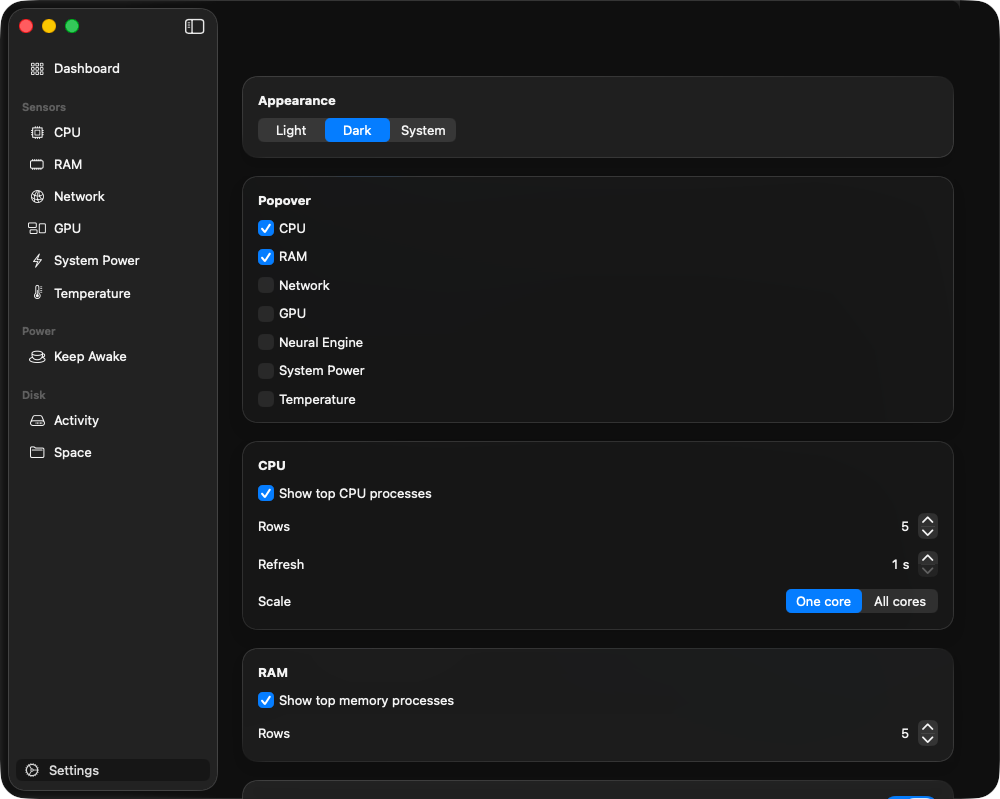
KeepStat Settings with CPU and RAM process list controls
Process list settingsRows, refresh, and One core or All cores

Exclusively engineered for Apple silicon

  • ArchitectureApple Silicon Mac (M1 through M5 or newer, arm64 only)
  • SystemmacOS 26 or later
  • InstallationDrag-and-drop DMG to Applications. Launch at login uses macOS service management. No launch daemons, no kernel extensions.

The download

  • Version2.1.0
  • What’s newNetwork shows which apps send and receive the most data. RAM lists the processes using the most memory. CPU use is about 0.3% of one core with the popover closed and about 3 to 5% with it open, compared with about 3.7% closed and 10.9% open before. Process lists are set in Settings, on a One core or All cores scale. Per-core loads stay while the CPU section is open.
  • PriceFree. No account.
  • Download2.2 MB. The DMG is 2,353,024 bytes.
  • Installed sizeAbout 4.8 MB (4,936 KB on disk). The arm64 binary is 1,481,888 bytes. Sparkle.framework is bundled for optional update checks.
  • While it is runningAbout every 5 seconds from the menu bar, or about every 1.5 seconds with the popover or window open. Charts keep about 8 minutes.
  • SensorsTemperature comes from HID. Frame rate and package energy come from IOReport. GPU percent comes from IOAccelerator.
  • Storage beside the appPreferences stay in UserDefaults. A disk scan is kept in memory for that session and is not written out as a database.

No tracking. Offline unless you opt in.

Your system metrics stay on your Mac. KeepStat has no tracking SDKs, no analytics, no ads, and no account. Sensor polling, disk scans, and hardware identifiers stay on-device.

Two optional network calls, both off until you turn them on. Show public IP asks api.ipify.org for this Mac’s address and shows the reply only when it is an IP. Turn that switch off and the address is cleared. Check for updates (asked once on first launch, and again in Settings) uses Sparkle to fetch the appcast at downloads.keepstat.realjamesmtz.dev. Per-app network totals are measured on this Mac and are not uploaded. Nothing else contacts the network.